



Quick Answer: Head shop profits increase through high-margin product focus, vendor consolidation, inventory optimization, strategic pricing, and category diversification. Retailers boosting disposable vape margins (40-50%), reducing vendor management costs, and adding kratom SKUs report 15-25% profit improvements.
Head shop profitability depends on smart inventory mix, efficient operations, and strong wholesale partnerships. Well-run smoke shops report gross margins of 35–50%, while stores reliant on low-margin cigarette sales often stall at 25-30%. At the same time, demand is accelerating across cannabis and hemp categories.
The global CBD market reached $10.68 billion in 2025 and is projected to grow to $30.96 billion by 2033 at a 13.70% CAGR, while the U.S. cannabis market was valued at $38.50 billion in 2024 and continues expanding at double-digit rates.
This guide outlines 10 proven strategies to increase head shop profitability through category optimization, supplier consolidation, pricing discipline, and operational improvements, with practical margin benchmarks and implementation tactics for retail operators.
Key Takeaways
- Focus inventory on high-margin categories like disposable vapes (40-50% margins) and premium THCa flower (45-60% margins) rather than low-margin tobacco products
- Consolidate 5+ vendor relationships into single multi-brand wholesale platforms to reduce management overhead by 15-25 hours monthly
- Implement velocity-based inventory planning that prioritizes fast-turning SKUs with 2-3 week reorder cycles over slow-moving specialty items
- Add complementary categories like kratom and nicotine products to diversify revenue streams and capture different customer demographics
- Partner with Alpha Brands for consolidated access to Mellow Fellow, Twenty One Cannabis, Eat Perks, Dopium, NICE, and Zombi under one wholesale relationship

1. Prioritize High-Margin Product Categories
Product mix determines overall profitability more than any other factor. Head shops stocking disposable vapes as 60-70% of cannabinoid inventory achieve dramatically higher margins than shops focused primarily on traditional tobacco products.
Margin Performance by Category
Different product categories deliver vastly different profitability profiles for wholesale buyers:
| Product Category | Typical Wholesale Margin | Average Reorder Cycle | Customer Demographics | Shelf Stability |
| Disposable Vapes | 40-50% | 2-3 weeks | 18-45, convenience-focused | 12-18 months |
| THCa Flower | 45-60% | 3-4 weeks | 25-55, cannabis-experienced | 6-12 months |
| Vape Cartridges | 35-45% | 3-4 weeks | 25-45, device owners | 12-18 months |
| Edibles | 40-50% | 4-6 weeks | 25-65, non-smokers | 6-12 months |
| Kratom Tablets | 45-55% | 2-4 weeks | 25-55, wellness-focused | 18-24 months |
| Nicotine Vapes | 30-40% | 2-3 weeks | 21-55, dual-use customers | 12-18 months |
Implementation tactics:
- Calculate margin per square foot for each product category in your current inventory. Products delivering less than 35% margin should be reduced or eliminated unless they drive traffic for higher-margin purchases.
- Stock fast-turning premium disposables like Mellow Fellow’s terp sauce 5ml line that combine strong margins (45-50% wholesale) with 2-3 week velocity. These SKUs generate consistent cash flow while maintaining profitability.
- Dedicate 15-20% of cannabinoid shelf space to premium THCa flower formats like Twenty One Cannabis prerolls. Flower appeals to experienced consumers willing to pay premium prices, delivering margins of 50-60% on properly sourced genetics.
Expected Impact: Shifting 20-30% of inventory from low-margin categories (traditional tobacco, basic glass) to high-margin cannabinoids and alternative products increases overall gross margin by 8-12 percentage points within one inventory cycle.
Read our latest Hazy Mary Donut Rolls Review.
2. Consolidate Wholesale Vendor Relationships
Managing 5+ separate vendor relationships consumes 15-25 hours monthly in order processing, payment coordination, shipment tracking, and compliance documentation management. This administrative overhead directly reduces profitability through labor costs and opportunity costs from time not spent on sales-generating activities.
Vendor Management Cost Comparison
| Operation | Traditional Multi-Vendor Model | Consolidated Platform Model | Time Savings | Cost Impact |
| Vendor Management | 15-25 hours/month | 3-5 hours/month | 12-20 hours | $300-$500/month |
| Order Processing | 8-12 separate orders | 1-2 consolidated orders | 70% reduction | $150-$250/month |
| Compliance Documentation | 5+ COA sources to track | Single documentation portal | 80% reduction | $100-$200/month |
| Fulfillment Coordination | 5+ shipments to receive | 1-2 shipments per cycle | 60% reduction | $50-$100/month |
| Payment Processing | 5+ invoices, payment methods | Single invoice system | 70% reduction | $75-$150/month |
| Account Support | Multiple contact channels | Dedicated account manager | Streamlined | Time savings |
Multi-brand wholesale platforms consolidate product access across categories under single vendor relationships. Rather than sourcing disposables from Vendor A, flower from Vendor B, kratom from Vendor C, and nicotine from Vendor D, retailers access complete category coverage through one platform.
Alpha Brands provides wholesale access to brands including Mellow Fellow, Twenty One Cannabis, Zombi, and Dopium through consolidated ordering, fulfillment (3-5 days domestic), and account management. This structure reduces vendor management complexity from 5+ relationships to one operational partnership.
Implementation tactics:
- Audit your current vendor list and categorize by product type, order frequency, and administrative burden. Identify vendors serving similar categories that could be consolidated.
- Request catalog access from multi-brand platforms and compare product availability, pricing, and MOQ requirements against your current vendor mix. Calculate total cost of ownership including time spent managing multiple relationships.
- Test consolidation by placing initial orders through platforms for 20-30% of your regular inventory needs. Monitor product quality, fulfillment speed, and account support before expanding the relationship.
Expected Impact: Consolidating from 5+ vendors to 1-2 strategic wholesale partners reduces administrative costs by $500-1,200 monthly while freeing 12-20 hours for revenue-generating activities like customer service and merchandising optimization.
3. Implement Velocity-Based Inventory Planning
Cash flow problems in head shops typically stem from capital tied up in slow-moving inventory rather than insufficient sales. Shops carrying 200+ SKUs with average 8-week turn rates generate less profit than shops focused on 80-100 fast-turning SKUs with 2-4 week velocity.
Velocity Optimization Framework
- Fast Movers: Reorder every 2-3 weeks, represent 30-40% of SKUs but 70-80% of revenue
- Steady Sellers: Reorder every 4-6 weeks, represent 30-40% of SKUs and 15-20% of revenue
- Specialty/Slow Movers: Reorder every 8+ weeks, represent 20-40% of SKUs but only 5-10% of revenue
Stock depth should mirror velocity. Fast movers deserve 4-6 weeks of inventory depth to prevent stockouts. Specialty items should carry 2-3 units maximum regardless of volume discount incentives from suppliers.
Track Metrics That Matter:
Calculate inventory turn rate by category: (Cost of Goods Sold / Average Inventory Value). Target 10-12 annual turns for cannabinoid categories, 6-8 turns for accessories and novelty items.
Measure gross margin return on investment (GMROI): (Gross Margin / Average Inventory Cost). Products below 200% GMROI should be reduced or eliminated unless they serve strategic purposes like traffic generation.

Implementation Tactics:
- Run monthly velocity reports identifying SKUs that haven’t sold in 60+ days. Discount these aggressively (30-50% off) to convert inventory back to cash even at reduced margins.
- Allocate freed working capital to proven fast movers. Increasing stock depth on disposables that turn every 2 weeks generates more profit than carrying 5 different slow-turning glass pieces that sit for months.
- Negotiate with wholesale suppliers for flexible reorder quantities on proven SKUs. Platforms offering mixed-brand ordering allow testing new products in small quantities (5-10 units) without committing to full case packs.
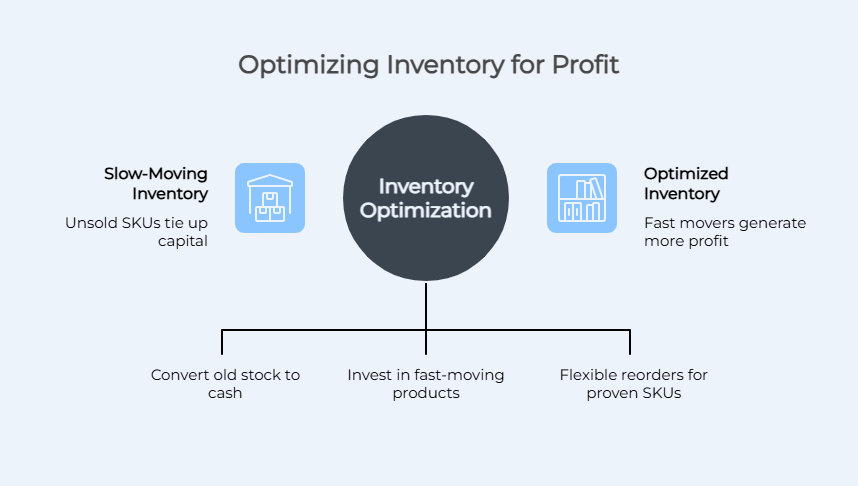
Expected Impact: Shifting 15-20% of inventory investment from slow-moving specialty items to fast-turning proven SKUs improves cash flow by 25-40% within one quarter while maintaining or increasing overall revenue.
4. Add Complementary Product Categories
Single-category dependence creates vulnerability to regulatory changes, supply disruptions, and market saturation. Head shops deriving 80%+ revenue from cannabinoid products face significant risk if state regulations change or market competition intensifies.
Category Diversification Strategy
Kratom represents one of the fastest-growing alternative product categories for smoke shops. The global kratom capsules market was valued at $218 million in 2024 and is projected to reach $376 million by 2032, growing at an 8.2% CAGR as consumer awareness increases and product formats continue to improve.
Tablets and standardized extracts now offer consistent dosing that appeals to wellness-focused customers distinct from traditional cannabinoid buyers.
Retailers adding kratom tablets like Eat Perks and 7evn report average margins of 45-55% with minimal cannabinoid customer overlap. This creates true revenue diversification rather than just product line extension.

Nicotine products capture dual-use customers and increase basket size. Smoke shops already serving adult consumers can expand into nicotine disposables with minimal operational changes.
The customer overlap between cannabinoid and nicotine users creates upsell opportunities. Buyers purchasing Delta-8 disposables frequently add nicotine vapes when positioned at checkout or through staff recommendation.
Implementation Tactics:
- Start with 10-15 SKUs in new categories rather than attempting comprehensive launches. Test market response before expanding inventory depth.
- Position new categories in dedicated shelf sections with clear signage explaining benefits and usage. Kratom requires more customer education than disposable vapes, so staff training becomes critical for conversion.
- Track cross-category purchasing patterns through POS data. Identify which customer segments buy multiple categories and develop bundling or loyalty incentives targeting those behaviors.
Expected Impact: Adding 2-3 complementary categories representing 20-30% of inventory reduces single-category dependence while increasing average transaction value by 15-25% among cross-category buyers.
5. Optimize Product Mix Within Categories
Category-level decisions matter, but SKU-level optimization within categories drives meaningful profit improvements. Shops carrying 40+ disposable vape SKUs often generate less profit than shops focused on 15-20 proven high-velocity options.
SKU Rationalization Process
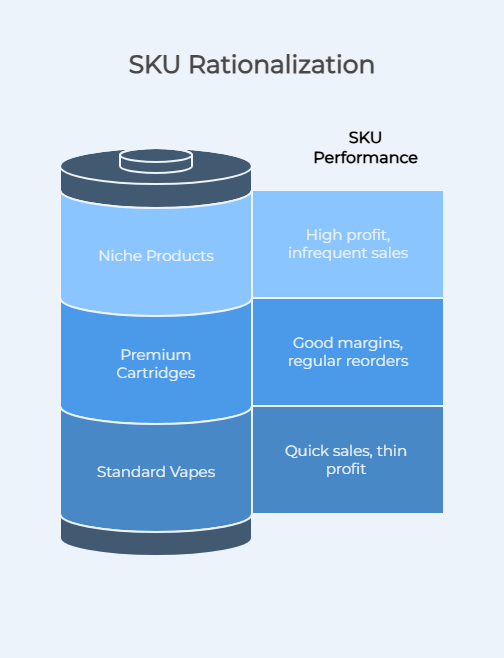
Identify Core Performers: Within each category, determine which 20% of SKUs generate 60-80% of category revenue. These core SKUs deserve maximum stock depth and prominent placement.
Evaluate Margin vs. Velocity Tradeoffs: Some products deliver high margins but slow velocity. Others turn quickly but provide thin margins. The optimal mix balances both factors.
For disposable vapes, premium 5-6ml formats like Zombi’s 2ml cartridges occupy a sweet spot – retail prices of $25-35 deliver 40-50% margins while capacity drives 2-3 week reorder cycles from regular customers.
Test New Products Systematically: Rather than ordering 20 units of every new SKU suppliers pitch, implement 5-unit test buys for unproven products. Monitor sales velocity over 4-6 weeks before committing to deeper inventory.
Implementation Tactics:
- Run ABC analysis on current inventory: A items (top 20% by revenue), B items (middle 30%), C items (bottom 50%). Reduce C-item variety by 40-50% and reinvest working capital in A-item depth.
- Measure margin per linear foot for shelf sections. Products occupying premium eye-level real estate should generate top-quartile margins and velocity. Relocate underperformers to lower shelves or eliminate entirely.
- Review new product performance monthly. SKUs not achieving 50% of category-average velocity after 60 days should be discounted aggressively and discontinued unless seasonal patterns explain slow performance.
Expected Impact: Reducing SKU count by 30-40% while maintaining revenue through deeper stock on proven items improves inventory turnover by 25-35% and reduces stockout frequency on best-sellers.
6. Implement Strategic Pricing Models
Markup consistency across all products leaves profit on the table. Different categories and brands support different pricing strategies based on customer price sensitivity, competitive landscape, and perceived value.
Pricing Strategy Framework
| Strategy Type | Best Use Case | Margin Impact | Implementation Complexity |
| Cost-Plus Pricing | Commodity products with transparent market pricing | Consistent 30-40% | Low – simple calculation |
| Competitive Pricing | High-visibility items customers price-shop | Matches market, 25-35% | Medium – requires market monitoring |
| Value-Based Pricing | Premium/specialty products with differentiation | Higher 45-60% | High – requires positioning |
| Bundle Pricing | Complementary products sold together | Improved basket size | Medium – requires product pairing |
| Volume Discounting | Bulk purchases by regular customers | Lower margin, higher velocity | Low – tiered pricing setup |
Implementation Tactics:
- Segment inventory into three pricing tiers: competitive (match market), standard (40-45% markup), premium (50-60% markup). Assign each SKU to appropriate tier based on customer price sensitivity and competitive intensity.
- Test bundle pricing on complementary products. A disposable vape + battery bundle or kratom tablets + beverage combo creates perceived value while increasing transaction size. Bundles support 5-10% lower margins per item but drive 20-30% higher basket values.
- Monitor competitor pricing monthly on 15-20 high-volume SKUs representing different categories. Adjust pricing to maintain competitive positioning on items customers price-shop while protecting margins on specialty products.
Expected Impact: Strategic pricing optimization increases overall gross margin by 3-6 percentage points while maintaining or improving sales volume through better price positioning by product type.
7. Reduce Operational Costs Through Efficiency
Gross margin improvements mean nothing if operational costs consume the gains. Head shops spending 18-22% of revenue on labor, rent, and overhead need efficiency improvements to translate top-line growth into bottom-line profit.
Cost Reduction Priorities
Labor Optimization: Staff scheduling should mirror traffic patterns. Shops overstaffing slow periods (weekday mornings) while understaffing peak hours (Friday-Saturday evenings) waste labor dollars and lose sales simultaneously.
Use POS data to identify peak traffic hours and schedule accordingly. Cross-train employees to handle multiple functions (sales, inventory receiving, merchandising) rather than maintaining specialized roles in small operations.
Inventory Handling Efficiency: Receiving, counting, and shelving inventory from 5+ vendors weekly consumes significant labor hours. Consolidated wholesale platforms reduce receiving frequency from 5-8 shipments weekly to 1-2, cutting inventory handling labor by 50-70%.
Products arriving with retail-ready packaging and barcodes require minimal handling versus loose inventory requiring repackaging, labeling, and manual SKU creation in POS systems.
Reduce Shrinkage and Waste: Inventory loss from theft, damage, or expiration typically ranges 2-5% of COGS in smoke shops. This represents pure profit loss that receives insufficient attention from many operators.
Implementation Tactics:
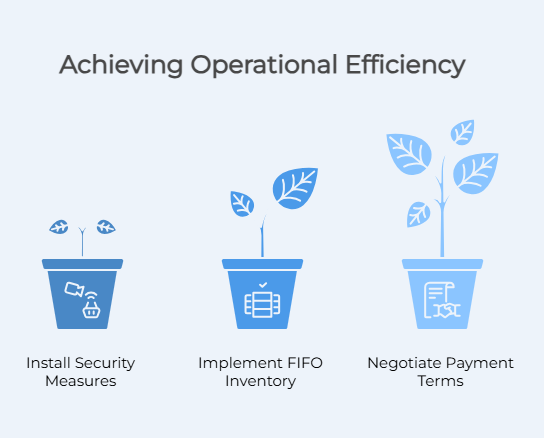
- Install basic security measures (cameras, magnetic tags on high-value items, employee bag checks) that reduce shrinkage by 30-50%. The ROI on security systems payback within 6-12 months through loss prevention alone.
- Implement first-in-first-out (FIFO) inventory rotation to minimize product expiration. Cannabinoid products maintain potency and quality for 12-18 months under proper storage but degrade faster when exposed to heat, light, or humidity.
- Negotiate payment terms with wholesale suppliers extending net-30 or net-45 credit. This improves cash flow by allowing product sale before payment due date, effectively providing free short-term financing.
Expected Impact: Operational efficiency improvements reducing costs by 2-3% of revenue translate directly to increased profit margins, adding $5,000-$15,000 annually to bottom line for shops generating $250K-$500K in annual revenue.
8. Improve Customer Retention and Lifetime Value
Acquiring new customers costs 5-10x more than retaining existing ones, yet head shops typically invest heavily in foot traffic generation while neglecting customer loyalty programs. Regular customers purchasing 2-3x monthly generate dramatically higher lifetime value than one-time buyers.
Retention Strategies That Work
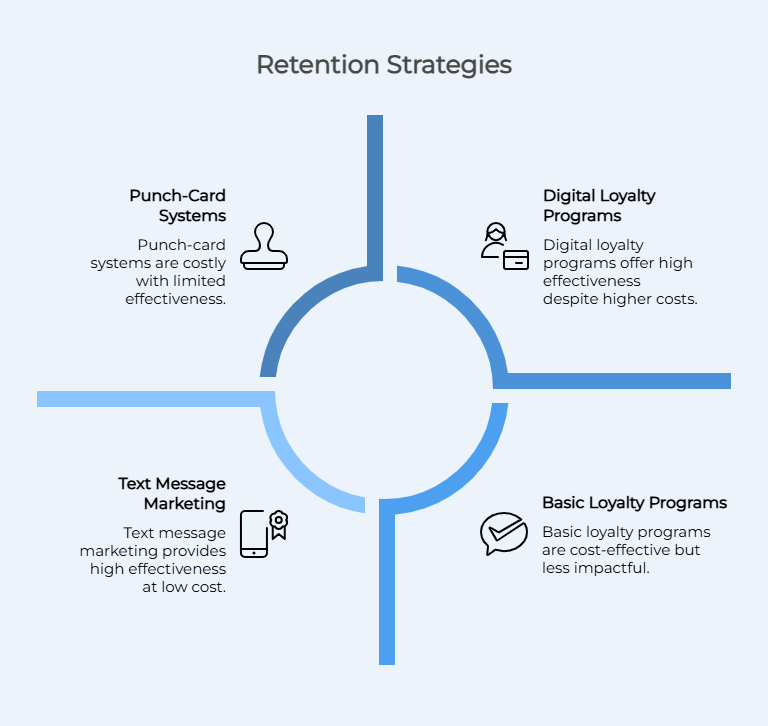
Implement Simple Loyalty Programs: Point-based systems rewarding repeat purchases drive 15-25% increases in purchase frequency among enrolled customers. Structure programs around behaviors you want to encourage – points for purchases, bonus points for trying new categories, redemption thresholds that encourage larger basket sizes.
Digital loyalty programs through POS systems cost $20-50 monthly but generate measurably higher returns than punch-card systems that customers forget or lose.
Text Message Marketing for Restock Reminders: Customers purchasing fast-consuming products (disposable vapes, kratom tablets) appreciate automated restock reminders timed to typical usage patterns. Text messages timed 2-3 weeks after disposable vape purchase achieve 15-30% conversion to repeat purchase.
Staff Product Knowledge Drives Conversion: Well-trained employees who understand product differences, can explain effects profiles, and make relevant recommendations increase average transaction value by 20-40% compared to order-taking staff who simply ring up customer selections.
Product training should focus on comparing options within categories (Delta-8 vs. THCa vs. HHC effects), explaining appropriate use cases (disposables for convenience vs. cartridges for device owners), and recommending complementary products (batteries for cartridges, beverages with edibles).
Implementation Tactics:
- Segment customers by purchase frequency and value through POS data. Identify top 20% of customers by annual spend and create VIP recognition programs (early access to new products, exclusive discounts, personalized service).
- Survey customers asking about satisfaction, product preferences, and unmet needs. This generates actionable feedback while making customers feel valued. Follow up on specific feedback showing you listened.
- Test cross-category recommendations with high-value customers. Buyers spending $500+ annually on cannabinoid products represent ideal targets for kratom sampling or premium format upgrades.
Expected Impact: Customer retention improvements increasing repeat purchase rate by 10-15% grow annual revenue by 12-20% without proportional increases in customer acquisition costs, directly improving profitability.
9. Leverage Seasonal Promotions and Events
Strategic promotional timing drives traffic during typically slow periods while maximizing revenue during natural peak seasons. Smoke shops running consistent promotions year-round dilute effectiveness and train customers to wait for sales rather than purchasing at full retail.
Promotional Calendar Strategy
Identify Slow Periods Requiring Traffic Generation: Most smoke shops experience predictable slow periods (January post-holiday, mid-summer vacation season). Targeted promotions during these windows improve baseline traffic without sacrificing margin during peak periods.
Align Promotions With Inventory Management Goals: Use 20-30% off promotions to clear slow-moving inventory identified through velocity tracking. This converts dead stock back to cash while creating perceived value for customers.
Event-Based Marketing Creates Urgency: Product launches, brand representative visits, and local events (concerts, festivals, conventions) provide natural promotion hooks that feel less transactional than “20% off everything” sales.
Implementation Tactics:
- Create 4-6 annual promotional events rather than continuous discounting. Examples: Spring cleaning sale (clear winter inventory), summer vacation kit bundles, back-to-school promotions, Black Friday weekend, year-end clearance.
- Bundle promotional pricing with loyalty enrollment. “Sign up for our text club and get 15% off today’s purchase” simultaneously drives sales and builds marketing database.
- Test vendor co-op marketing opportunities. Some wholesale suppliers provide promotional budgets supporting in-store demos, sample products, or co-branded marketing materials that reduce retailer promotional costs while driving brand awareness.
Expected Impact: Strategic seasonal promotions increase revenue during slow periods by 20-35% while maintaining full margins during peak seasons, improving annual profitability by 3-5% compared to constant promotional discounting.
10. Monitor Key Performance Indicators Consistently
Profit improvement requires measuring the right metrics and responding to performance data. Head shops tracking only daily sales totals miss critical trends in margin performance, inventory efficiency, and customer behavior that drive long-term profitability.
Essential Metrics to Track
Gross Margin Percentage by Category and Overall: Calculate monthly gross profit (revenue minus COGS) divided by revenue. Overall margins should trend 40-50% for shops with optimized product mix. Declining margins indicate pricing pressure, product mix shifts toward lower-margin items, or shrinkage issues.
Track gross margin by product category (disposables, flower, edibles, kratom, nicotine, accessories) to identify underperforming segments requiring attention.
Inventory Turnover by Category: Calculate turns (COGS / average inventory value) quarterly. Target 10-12 annual turns for consumables (cannabinoids, kratom, nicotine), 4-6 turns for accessories and novelty items. Declining turnover indicates overstocking, poor product selection, or insufficient sales velocity.

Average Transaction Value and Basket Size: Track average sale amount and items per transaction monthly. Declining basket size suggests missed cross-selling opportunities or customer trading down to lower-priced options.
Customer Acquisition Cost and Lifetime Value: Calculate total marketing spending divided by new customers acquired monthly. Compare to average customer lifetime value (average purchase frequency x average transaction size x customer lifespan). Customer LTV should exceed acquisition cost by 3x minimum for sustainable growth.
Implementation Tactics:
- Build simple dashboards tracking 8-10 key metrics updated monthly. Most modern POS systems generate these reports automatically – the challenge is reviewing data and acting on insights rather than data collection itself.
- Set performance targets for each metric based on historical trends and industry benchmarks. Review monthly performance against targets and investigate variances exceeding 10-15%.
- Share key metrics with employees (maintaining appropriate confidentiality on financial details). Staff understanding business performance and personal contribution to profitability increases engagement and improves execution of profit-improvement initiatives.
Expected Impact: Consistent KPI monitoring and data-driven decision-making prevents profit erosion and identifies improvement opportunities 3-6 months earlier than shops relying on gut feel and annual financial statements.
Get Started Boosting Your Head Shop Profits
Head shop profitability improves through strategic decisions in product selection, vendor relationships, inventory management, and operational efficiency. Shops implementing 4-5 of these strategies report profit improvements of 15-25% within 6-12 months without requiring significant capital investment.
The foundation of sustainable profitability is reliable wholesale suppliers providing high-margin products with consistent availability and compliance documentation. Rather than managing multiple vendor relationships across categories, successful retailers consolidate sourcing through platforms offering multi-brand access.
Alpha Brands provides wholesale distribution across cannabinoid disposables, THCa flower, kratom tablets, and nicotine products through brands including Mellow Fellow, Twenty One Cannabis, Zombi, NICE, Eat Perks, and Dopium. This consolidation reduces vendor management complexity while maintaining product breadth across high-margin categories.
For head shop operators ready to improve profitability through better supplier relationships, contact Alpha Brands wholesale sales to discuss catalog access, pricing, and account onboarding.
Frequently Asked Questions
What Are the Most Profitable Products to Sell in a Head Shop?
Disposable cannabinoid vapes (40-50% margins), premium THCa flower (45-60% margins), and kratom tablets (45-55% margins) deliver the highest wholesale profitability. Products combining strong margins with 2-4 week reorder velocity generate optimal cash flow and profit per square foot.
How Can I Reduce Costs in My Smoke Shop?
Consolidate vendor relationships from 5+ suppliers to 1-2 multi-brand platforms, reducing management overhead by 15-25 hours monthly. Optimize labor scheduling to match traffic patterns, implement inventory controls reducing shrinkage 2-4%, and negotiate extended payment terms with suppliers improving working capital.
What Profit Margins Should I Expect in a Head Shop?
Well-managed smoke shops with optimized product mix achieve overall gross margins of 40-50%. Shops dependent on low-margin tobacco products struggle to exceed 30% margins. Net profit margins after operating expenses typically range 8-15% for efficient operators.
How Do I Increase Customer Spending per Visit?
Train staff on cross-category recommendations (kratom with disposables, batteries with cartridges), implement bundle pricing on complementary products, position impulse items at checkout, and use loyalty programs rewarding larger basket sizes. These tactics increase average transaction value 20-35%.
Should I Carry Every Brand Customers Request?
Carrying too many brands in the same category fragments inventory investment and increases management complexity. Focus on 2-3 proven brands per category delivering consistent quality and velocity. Multi-brand wholesale platforms like Alpha Brands provide category breadth through single vendor relationships without inventory proliferation.
How Often Should I Reorder Inventory?
Reorder frequency should match product velocity. Fast-moving disposables require 2-3 week reorder cycles maintaining 4-6 weeks stock depth. Specialty items might reorder every 8-12 weeks. Consolidated platforms supporting mixed-category ordering reduce shipping frequency while maintaining inventory freshness.
What’s the Best Way to Find Wholesale Suppliers?
Research multi-brand distribution platforms offering category breadth rather than managing 5+ single-brand relationships. Evaluate suppliers based on COA accessibility, fulfillment speed (3-5 days target), compliance documentation, and account support quality – not just pricing.
Sources
- Kratom Capsules Market Outlook 2025-2032
- Cannabidiol Market Size And Share | Industry Report, 2033
- U.S. Cannabis Market Size & Share | Industry Report, 2030
Meta Title: 10 Ways to Boost Head Shop Profits | Wholesale Strategy Guide
Meta Description: Increase head shop profitability through high-margin products, vendor consolidation, inventory optimization, and strategic pricing. B2B guide for smoke shop retailers.
URL Slug: /blog/ways-boost-head-shop-profits/